CNVinspector
Tutorial
best viewed with Mozilla Firefox
This tutorial is as brief as possible, if you are interested in more detailed information or in the implementation, please consult the documentation. Unless mentioned here, there is no need to change any settings on the interfaces.
1. Create a personal account
Go to the create
profile page and enter your name, an e-mail address, your
organisation and select your login name and a password. You will
be logged in automatically (your browser must accept cookies for
this function). If you return to CNVinspector (we hope you will),
go to the login page to
create and access your private data. More about the publication
and the exchange of your data can be found in the documentation.
2. Upload CNVs
First, you must upload CNVs. For this tutorial, sample CNVs for a patient with DiGeorge Syndrome exist. To actually upload the CNVs to the database, open the upload page.
- Describe your study under description (e.g. 'a test').
- Under method (brief), select the method that best suits the method you used (we recommend 'other').
- Enter a more detailed description of your method under method (e.g. 'just a test').
- Enter the number of samples contained in your study under sample size. If you use the sample file, the number should be 24.
- Choose the correct genome build (37 for the sample file).
- Select the file you want to upload (e.g. DiGeorge sample file).
- Click on submit and wait for 15 seconds.
- When the upload finished, click on the link 'Study your CNVs'.
3. Display CNVs within a genomic region.
You are now on the display / find CNVs in single patients page
- Select your project as cases
or click here to use the sample CNVs already in the database. - If you want to visualize the DECIPHER data along with the CNVs of your patient you have to be logged-in and have checked include DECIPHER data and confirmed the disclaimer (only once).
- Choose some other studies as controls (by checking display as controls.
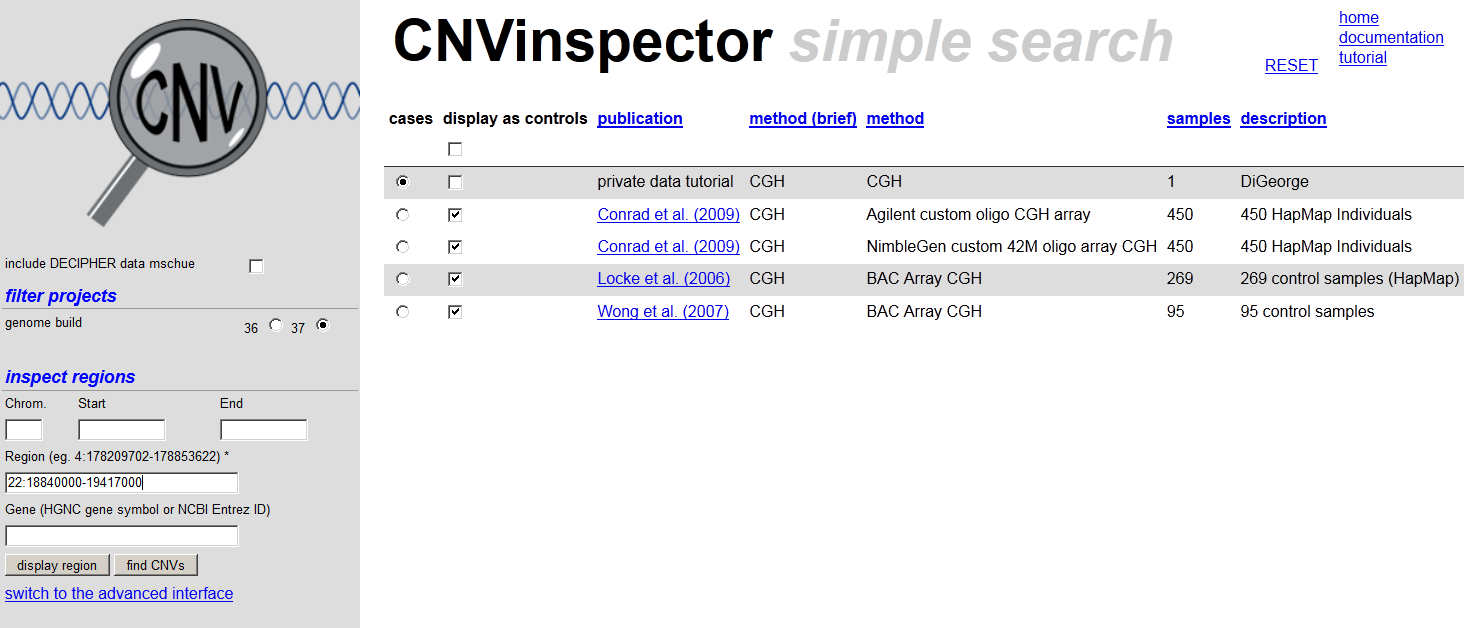
- If you want to see all CNVs of your patient, press find CNVs and leave the other fields empty. Click on a gene symbol to read gene information. If you choose display, the next page shows the genes and the CNVs contained within a definite region. In the plot, genes are indicated as green bars, duplications in blue, and deletions in red. Control CNVs are displayed in light colours.
- If you want to inspect a given region, e.g. enter '22: 18840000-19417000 in region and click on
display region (Fig.1). This page shows the genes and the CNVs, from the projects you selected, contained within your region. In the plot, genes are indicated as green bars, duplications in blue, and deletions in red. Control CNVs are displayed in light colours.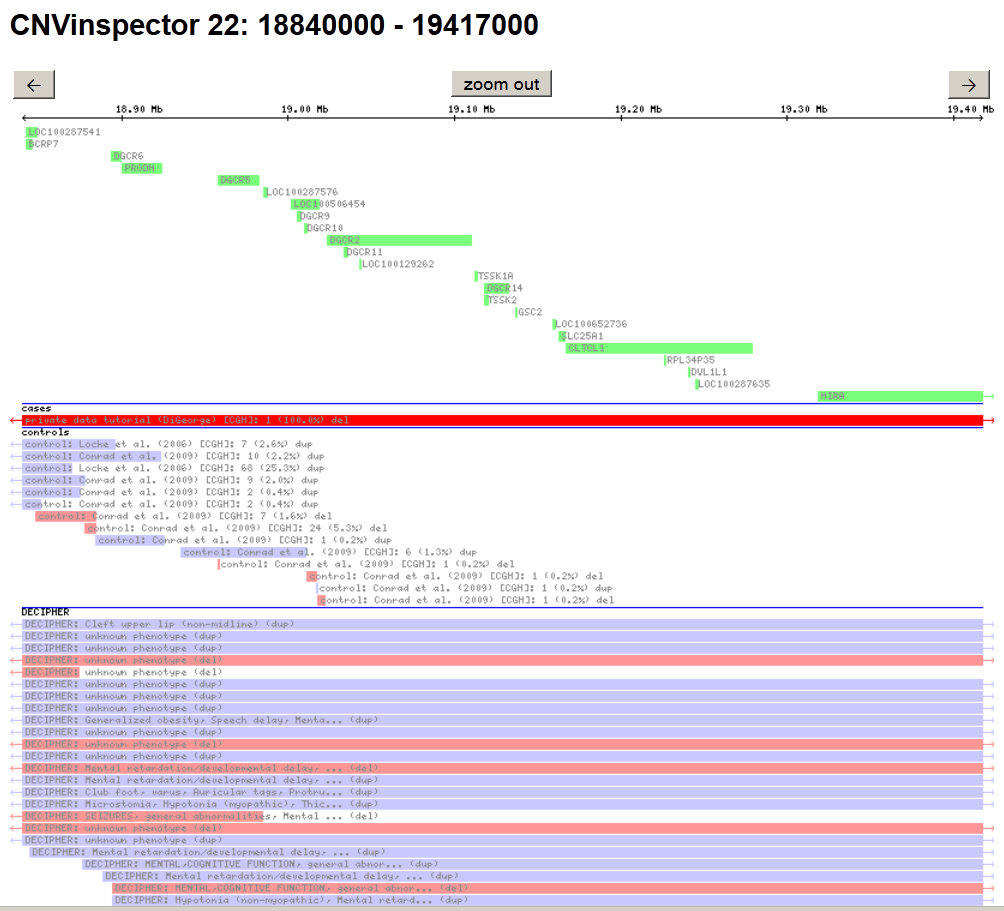
Scroll down to the bottom to read the actual positions of the genes and CNVs in the genome build you have selected. You will also find information about cases and controls you have selected.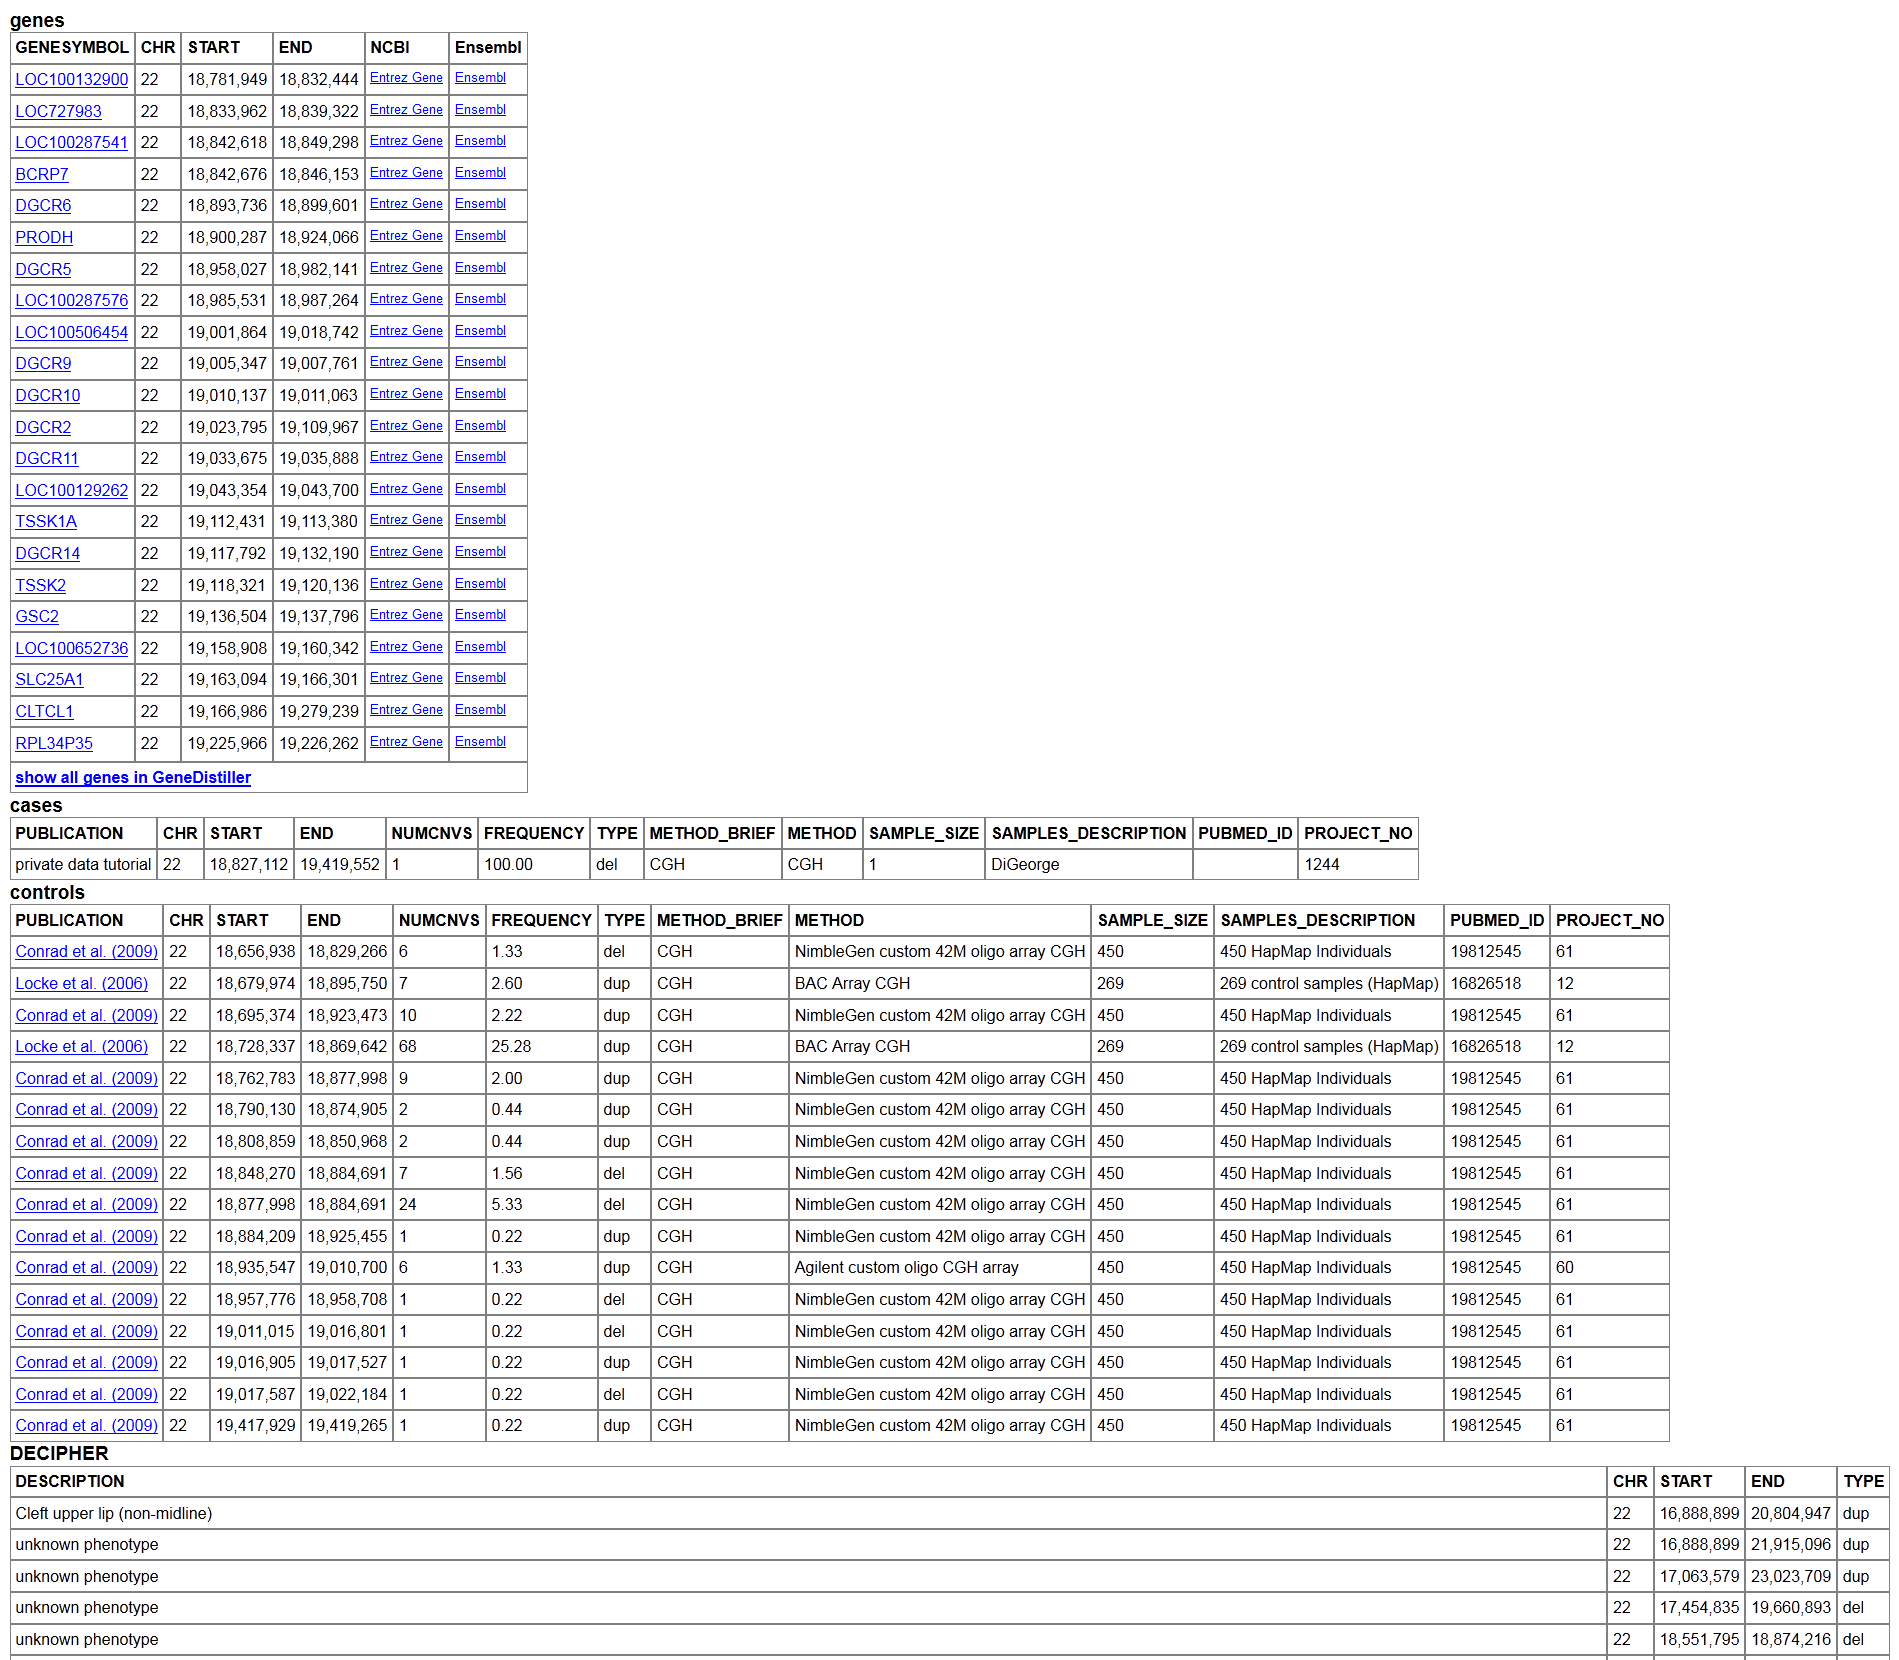
4. Remove projects or analysis
Go to the delete your data page. All projects and analyses owned by you will be displayed.
- Select an analysis or project you want to delete.
- Click on the Delete selected projects button.
- On the page that now opens, click on the Confirm button.
Congratulations!
You have now completed the tutorial.
This tutorial is meant only as a brief introduction to CNVinspector. Please read the documentation if you are interested in the elements not mentioned here. And if any questions remain unanswered, don't hesitate to ask us (e-mail to dominik.seelow (at) charite.de). We would also appreciate hearing of your experiences, bugs you discovered, and suggestions to improve this application.